Electrify Chicago
An independent tool for viewing City of Chicago building data
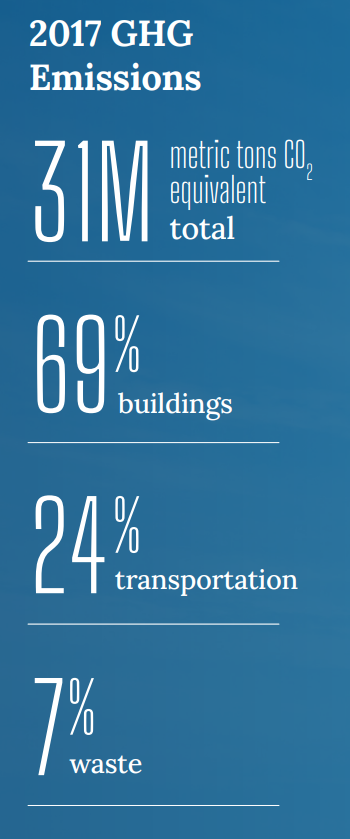
According to the
2022 Chicago Climate Action Plan ,
a whopping 69% of Chicago's emissions come from buildings, making it
our biggest challenge and our biggest opportunity as a city to tackle
change. At Electrify Chicago, we want to showcase some of the best and worst performing
buildings in the city using publicly available data and manual annotations to add
building photographs and label multi-building owners like universities.
,
a whopping 69% of Chicago's emissions come from buildings, making it
our biggest challenge and our biggest opportunity as a city to tackle
change. At Electrify Chicago, we want to showcase some of the best and worst performing
buildings in the city using publicly available data and manual annotations to add
building photographs and label multi-building owners like universities.
You can start by looking at Chicago's buildings with the highest greenhouse gas intensity - this means that they use the most energy when adjusted per unit of square foot, so big buildings could actually perform much better than very inefficient small buildings on this metric.
New Article
📰 $30 Million In Missed Fines
The City Of Chicago failed to collect $30 million in potential fines from the building benchmarking ordinance, reducing transparency and accountability.
Legislative update! 🎉
As of late January 2024, legislation is being introduced to require new use more efficient forms of water and space heating, via the Clean And Affordable Buildings Ordinance (CABO), which will reduce the number of highly polluting and inefficient buildings that end up on this site.
If you're in Chicago,
write to your alderman to support the CABO!
Chicago Buildings by Greenhouse Gas Intensity
Note: Data only includes large Chicago buildings from 2021, unless explicitly stated otherwise.
Note: This data only includes buildings whose emissions are reported
under the
Chicago Energy Benchmarking Ordinance. According to the City “As of 2016,
this list includes all commercial, institutional, and residential buildings larger than
50,000 square feet.” This dataset is also then filtered to only buildings with
reported emissions > 1,000 metric tons CO2 equivalent.
This data is also from 2021, but when new benchmark data is available, we'll update the site.
| Property Name / address | Primary Property Type |
Greenhouse Gas Intensity (kg CO2 eq./sqft) |
Total Greenhouse Emissions (metric tons CO2 eq.) |
|---|---|---|---|
|
2101 S Wabash Ave
2101 S WABASH AVE
| Multifamily Housing | 5.9 kg/sqft
Lowest 39%
| 188 tons
Lowest 2%
|
|
20 E Cedar Condominium
20 E CEDAR ST
| Multifamily Housing | 5.9 kg/sqft
Lowest 39%
| 994 tons
Highest 45%
|
|
3963 W. Belmont
3963 W BELMONT AVE
| Multifamily Housing | 5.9 kg/sqft
Lowest 39%
| 1,469 tons
Highest 32%
|
|
Hollywood Property
1040 W HOLLYWOOD AVE
| Multifamily Housing | 5.9 kg/sqft
Lowest 39%
| 362 tons
Lowest 14%
|
|
544 W. Melrose St.
544 W MELROSE ST
| Multifamily Housing | 5.9 kg/sqft
Lowest 39%
| 300 tons
Lowest 9%
|
|
447-457 W. Wellington Ave.
447 457 W WELLINGTON AVE
| Multifamily Housing | 5.9 kg/sqft
Lowest 39%
| 305 tons
Lowest 10%
|
|
625 N Michigan Avenue
625 N Michigan Ave
| Office | 5.9 kg/sqft
Lowest 39%
| 2,104 tons
Highest 21%
|
|
Daley Center
14 E Jackson Blvd
| College/University | 5.9 kg/sqft
Lowest 39%
| 2,185 tons
Highest 20%
|
|
5034 S Woodlawn Ave
5034 5040 S WOODLAWN AVE
| Multifamily Housing | 5.9 kg/sqft
Lowest 39%
| 364 tons
Lowest 14%
|
|
239-Senior Suites of Marquette Village
7430 S ROCKWELL ST
| Senior Living Community | 5.9 kg/sqft
Lowest 39%
| 460 tons
Lowest 23%
|
|
2609 W. Belmont Apartments
2609 W BELMONT AVE
| Multifamily Housing | 5.9 kg/sqft
Lowest 39%
| 519 tons
Lowest 28%
|
|
The Residences at Eight East Huron (gh23)
8 E Huron St
| Multifamily Housing | 5.8 kg/sqft
Lowest 37%
| 1,002 tons
Highest 45%
|
|
The Western 1912-1920 N Milwaukee
1920 N Milwaukee Ave
| Multifamily Housing | 5.8 kg/sqft
Lowest 37%
| 356 tons
Lowest 14%
|
|
SP/RPA 1325 Apartments LLC
1325 N WELLS ST
| Multifamily Housing | 5.8 kg/sqft
Lowest 37%
| 356 tons
Lowest 14%
|
|
Xavier (xv01)
625 W Division St
| Multifamily Housing | 5.8 kg/sqft
Lowest 37%
| 1,354 tons
Highest 34%
|
Data Source:
Chicago Energy Benchmarking Data