Electrify Chicago
An independent tool for viewing City of Chicago building data
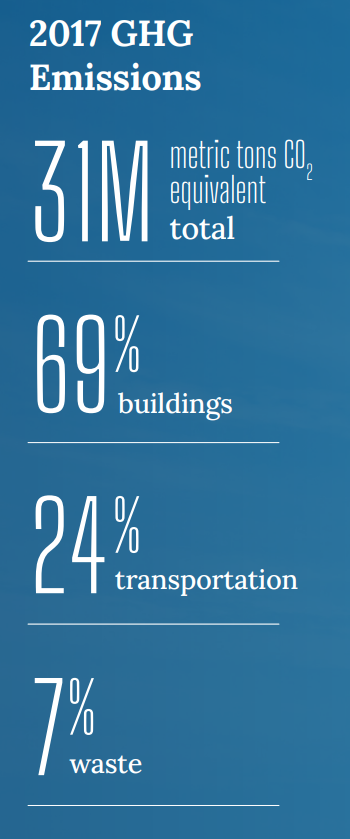
According to the
2022 Chicago Climate Action Plan ,
a whopping 69% of Chicago's emissions come from buildings, making it
our biggest challenge and our biggest opportunity as a city to tackle
change. At Electrify Chicago, we want to showcase some of the best and worst performing
buildings in the city using publicly available data and manual annotations to add
building photographs and label multi-building owners like universities.
,
a whopping 69% of Chicago's emissions come from buildings, making it
our biggest challenge and our biggest opportunity as a city to tackle
change. At Electrify Chicago, we want to showcase some of the best and worst performing
buildings in the city using publicly available data and manual annotations to add
building photographs and label multi-building owners like universities.
You can start by looking at Chicago's buildings with the highest greenhouse gas intensity - this means that they use the most energy when adjusted per unit of square foot, so big buildings could actually perform much better than very inefficient small buildings on this metric.
New Article
📰 $30 Million In Missed Fines
The City Of Chicago failed to collect $30 million in potential fines from the building benchmarking ordinance, reducing transparency and accountability.
Legislative update! 🎉
As of late January 2024, legislation is being introduced to require new use more efficient forms of water and space heating, via the Clean And Affordable Buildings Ordinance (CABO), which will reduce the number of highly polluting and inefficient buildings that end up on this site.
If you're in Chicago,
write to your alderman to support the CABO!
Chicago Buildings by Greenhouse Gas Intensity
Note: Data only includes large Chicago buildings from 2021, unless explicitly stated otherwise.
Note: This data only includes buildings whose emissions are reported
under the
Chicago Energy Benchmarking Ordinance. According to the City “As of 2016,
this list includes all commercial, institutional, and residential buildings larger than
50,000 square feet.” This dataset is also then filtered to only buildings with
reported emissions > 1,000 metric tons CO2 equivalent.
This data is also from 2021, but when new benchmark data is available, we'll update the site.
| Property Name / address | Primary Property Type |
Greenhouse Gas Intensity (kg CO2 eq./sqft) |
Total Greenhouse Emissions (metric tons CO2 eq.) |
|---|---|---|---|
|
JeffJack
601 W Jackson
| Multifamily Housing | 5.7 kg/sqft
Lowest 35%
| 1,318 tons
Highest 35%
|
|
Matthew Manor
271 N Albany Ave
| Multifamily Housing | 5.7 kg/sqft
Lowest 35%
| 301 tons
Lowest 9%
|
|
Philip Rogers Elementary School
(CPS)
7345 N Washtenaw Ave
| K-12 School | 5.7 kg/sqft
Lowest 35%
| 515 tons
Lowest 28%
|
|
Robert Healy Elementary School
(CPS)
3010 S Parnell Ave
| K-12 School | 5.7 kg/sqft
Lowest 35%
| 660 tons
Lowest 39%
|
|
William G Hibbard Elementary School
(CPS)
3244 W Ainslie St
| K-12 School | 5.7 kg/sqft
Lowest 35%
| 966 tons
Highest 46%
|
|
Claremont Academy Elementary School
(CPS)
6315 S Claremont Ave
| K-12 School | 5.7 kg/sqft
Lowest 35%
| 647 tons
Lowest 38%
|
|
Charles N Holden Elementary School
(CPS)
1104 W 31st St
| K-12 School | 5.7 kg/sqft
Lowest 35%
| 565 tons
Lowest 32%
|
|
John J Pershing Elementary Humanities Magnet
(CPS)
3200 S Calumet Ave
| K-12 School | 5.7 kg/sqft
Lowest 35%
| 735 tons
Lowest 43%
|
|
Christian Ebinger Elementary School
(CPS)
7350 W Pratt Ave
| K-12 School | 5.7 kg/sqft
Lowest 35%
| 537 tons
Lowest 30%
|
|
Ellen Mitchell Elementary School
(CPS)
2233 W Ohio St
| K-12 School | 5.7 kg/sqft
Lowest 35%
| 320 tons
Lowest 11%
|
|
State and Chestnut
845 N State St
| Multifamily Housing | 5.7 kg/sqft
Lowest 35%
| 2,582 tons
Highest 16%
|
|
720 Gordon Terrace Condominium Association
720 W Gordon Ter
| Multifamily Housing | 5.7 kg/sqft
Lowest 35%
| 1,630 tons
Highest 29%
|
|
Jackson Shore Coop Apartments Corp
5490 S Shore Dr
| Multifamily Housing | 5.7 kg/sqft
Lowest 35%
| 568 tons
Lowest 32%
|
|
Carl Sandburg Village Condo Association #1
1355 N Sandburg Ter
| Multifamily Housing | 5.7 kg/sqft
Lowest 35%
| 4,119 tons
Highest 9%
|
|
(IL1074) ParkShore Condominium
195 N Harbor Dr
| Multifamily Housing | 5.7 kg/sqft
Lowest 35%
| 5,787 tons
Highest 6%
|
Data Source:
Chicago Energy Benchmarking Data