Electrify Chicago
An independent tool for viewing City of Chicago building data
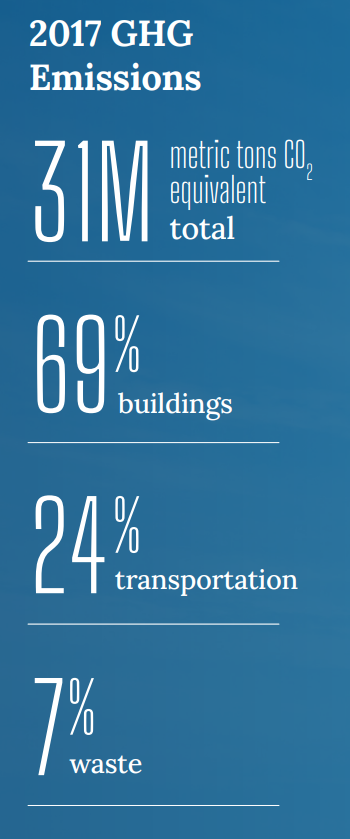
According to the
2022 Chicago Climate Action Plan ,
a whopping 69% of Chicago's emissions come from buildings, making it
our biggest challenge and our biggest opportunity as a city to tackle
change. At Electrify Chicago, we want to showcase some of the best and worst performing
buildings in the city using publicly available data and manual annotations to add
building photographs and label multi-building owners like universities.
,
a whopping 69% of Chicago's emissions come from buildings, making it
our biggest challenge and our biggest opportunity as a city to tackle
change. At Electrify Chicago, we want to showcase some of the best and worst performing
buildings in the city using publicly available data and manual annotations to add
building photographs and label multi-building owners like universities.
You can start by looking at Chicago's buildings with the highest greenhouse gas intensity - this means that they use the most energy when adjusted per unit of square foot, so big buildings could actually perform much better than very inefficient small buildings on this metric.
New Article
📰 $30 Million In Missed Fines
The City Of Chicago failed to collect $30 million in potential fines from the building benchmarking ordinance, reducing transparency and accountability.
Legislative update! 🎉
As of late January 2024, legislation is being introduced to require new use more efficient forms of water and space heating, via the Clean And Affordable Buildings Ordinance (CABO), which will reduce the number of highly polluting and inefficient buildings that end up on this site.
If you're in Chicago,
write to your alderman to support the CABO!
Chicago Buildings by Greenhouse Gas Intensity
Note: Data only includes large Chicago buildings from 2021, unless explicitly stated otherwise.
Note: This data only includes buildings whose emissions are reported
under the
Chicago Energy Benchmarking Ordinance. According to the City “As of 2016,
this list includes all commercial, institutional, and residential buildings larger than
50,000 square feet.” This dataset is also then filtered to only buildings with
reported emissions > 1,000 metric tons CO2 equivalent.
This data is also from 2021, but when new benchmark data is available, we'll update the site.
| Property Name / address | Primary Property Type |
Greenhouse Gas Intensity (kg CO2 eq./sqft) |
Total Greenhouse Emissions (metric tons CO2 eq.) |
|---|---|---|---|
|
Mundelein Center- ID#102408
1020 W Sheridan Rd
| College/University | 8.3 kg/sqft
Highest 24%
| 1,713 tons
Highest 28%
|
|
Walt Disney Magnet Elementary School
(CPS)
4140 N Marine Dr
| K-12 School | 8.3 kg/sqft
Highest 24%
| 2,151 tons
Highest 21%
|
|
150 North Wacker Drive
150 N Wacker Dr
| Office | 8.3 kg/sqft
Highest 24%
| 2,188 tons
Highest 20%
|
|
First Praire Shores, LLC
2901 S King Dr
| Multifamily Housing | 8.3 kg/sqft
Highest 24%
| 2,414 tons
Highest 18%
|
|
Addison Towers
510 534 W ADDISON ST
| Multifamily Housing | 8.3 kg/sqft
Highest 24%
| 572 tons
Lowest 33%
|
|
Hampden Green Condominium Association
2728 N HAMPDEN CT
| Multifamily Housing | 8.2 kg/sqft
Highest 25%
| 1,148 tons
Highest 40%
|
|
1767 North Milwaukee Avenue
1767 N Milwaukee Ave
| Multifamily Housing | 8.2 kg/sqft
Highest 25%
| 482 tons
Lowest 25%
|
|
Red Shield Center
945 W 69th St
| Mixed Use Property | 8.2 kg/sqft
Highest 25%
| 411 tons
Lowest 19%
|
|
400 W. Erie
400 W Erie St
| Office | 8.2 kg/sqft
Highest 25%
| 607 tons
Lowest 35%
|
|
1259 - Sonesta ES Suites Chicago Downtown 201 East Walton Place
201 E Walton Pl
| Hotel | 8.2 kg/sqft
Highest 25%
| 1,453 tons
Highest 32%
|
|
Peter V. Byrne Hall
2219 N Kenmore Ave
| College/University | 8.2 kg/sqft
Highest 25%
| 635 tons
Lowest 38%
|
|
Galileo Math & Science Scholastic Academy ES
(CPS)
820 S Carpenter St
| K-12 School | 8.2 kg/sqft
Highest 25%
| 847 tons
Lowest 49%
|
|
Munroe Hall
2312 N Clifton Ave
| College/University | 8.2 kg/sqft
Highest 25%
| 676 tons
Lowest 40%
|
|
Lofts and Fairbanks at CityFront Plaza
240 E Illinois St
| Multifamily Housing | 8.2 kg/sqft
Highest 25%
| 4,868 tons
Highest 7%
|
|
The Residences at Joffrey Tower Condo Association
8 E Randolph St
| Multifamily Housing | 8.2 kg/sqft
Highest 25%
| 3,365 tons
Highest 11%
|
Data Source:
Chicago Energy Benchmarking Data